


Volatility is a measure of how much and how quickly prices move in financial markets. A highly volatile market shows frequent and significant price changes, while a low-volatility market tends to have smaller, steadier movements.
Understanding volatility is essential for interpreting market behavior. It affects pricing, liquidity, and the overall experience of participants in any asset class.
Risk Warning: CFDs are complex instruments and come with a high risk of losing all your invested capital. You should consider whether you understand how CFDs work and whether you can afford to take the high risk of losing your investment.
What Is Market Volatility?
Volatility refers to the degree of variation in the price of a financial instrument over a certain period. It is commonly expressed as a percentage or index that shows how much prices deviate from their average.
In simple terms, volatility reflects the level of uncertainty and movement in a market.
For CFDs, volatility is particularly important because it directly affects the potential gains and losses, often magnified by leverage. The volatility of the underlying asset drives the CFD price and the associated risk.
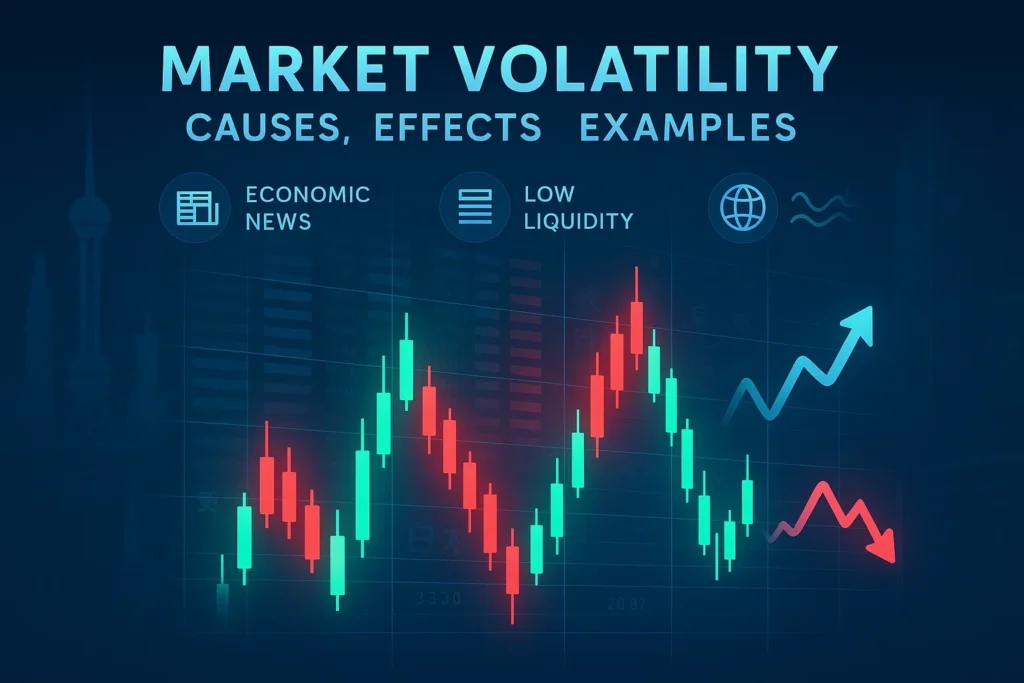
Causes of Market Volatility
Volatility can be triggered by a wide range of factors.
Economic Data Releases
Announcements such as employment reports, inflation figures, or central bank decisions often move markets quickly.
Geopolitical Events
Elections, conflicts, or unexpected political developments can increase uncertainty and drive rapid price swings.
Market Sentiment
Shifts in confidence — whether optimistic or fearful — can lead to sudden changes in buying and selling activity.
Liquidity Conditions
When liquidity is low, even modest trades can cause outsized price movements, increasing volatility.
Types of Volatility
There are different ways of categorizing volatility.
- Historical volatility: Based on past price movements over a defined time frame.
- Implied volatility: Derived from option pricing models, reflecting expectations of future movement.
- Intraday volatility: Price fluctuations within a single trading session.
Each type provides a different perspective on how markets behave.
Measuring Volatility
Several tools and indicators are used to measure volatility.
- Standard deviation: Shows how much prices deviate from the mean.
- Average True Range (ATR): Measures the average daily movement of a market.
- Volatility Index (VIX): Known as the “fear gauge,” it reflects expected volatility in the U.S. stock market.
These measures help participants evaluate current conditions.
Effects of Volatility on Markets
Volatility has wide-ranging effects on market functioning.
Pricing
High volatility can lead to rapid changes in quotes and wider bid-ask spreads.
Liquidity
During volatile periods, liquidity may decline as participants hesitate to place large orders.
Risk
Volatility increases uncertainty and can result in larger-than-expected changes in portfolio values.
Volatility in Different Asset Classes
Not all markets display the same level of volatility.
| Asset Class | Typical Volatility Level | Notes |
| Major Forex Pairs | Low to Medium | Often stable, except during key events |
| Commodities (Oil) | High | Sensitive to supply and geopolitical news |
| Equity Indices | Medium | Varies with earnings and macro data |
| Small-Cap Stocks | High | Thin liquidity often causes sharp moves |
These differences show why volatility must be understood in context.
For CFDs, the volatility of the underlying asset determines the potential price swings of the CFD, impacting both risk and opportunity for traders.
Historical Examples of Volatility
Financial Crisis of 2008
Equity markets around the world experienced extreme volatility, with daily swings of several percentage points.
Oil Price Shock 2020
Global crude oil markets saw unprecedented volatility when demand collapsed, leading to negative prices for certain contracts.
Pandemic-Driven Uncertainty
In early 2020, volatility surged across nearly every asset class as participants reacted to global lockdowns and economic disruption.
These examples illustrate how volatility can be driven by both financial and non-financial factors.
Volatility vs Risk
Although often linked, volatility is not the same as risk.
- Volatility is a measure of how much prices move.
- Risk is the possibility of losing capital due to adverse price changes.
While high volatility can increase risk exposure, they remain distinct concepts.
Common Misconceptions About Volatility
- Volatility is always bad: Volatility is natural in markets and sometimes necessary for price discovery.
- Low volatility means safety: Stable markets can still experience sudden shocks.
- Volatility is predictable: While patterns exist, volatility often arises unexpectedly.
Clarifying these points helps participants form realistic expectations.
Final Thoughts
Volatility is a fundamental part of financial markets. It reflects the degree of uncertainty and price movement over time. By understanding its causes, measurement methods, and effects, participants can better interpret the conditions they face in different markets.