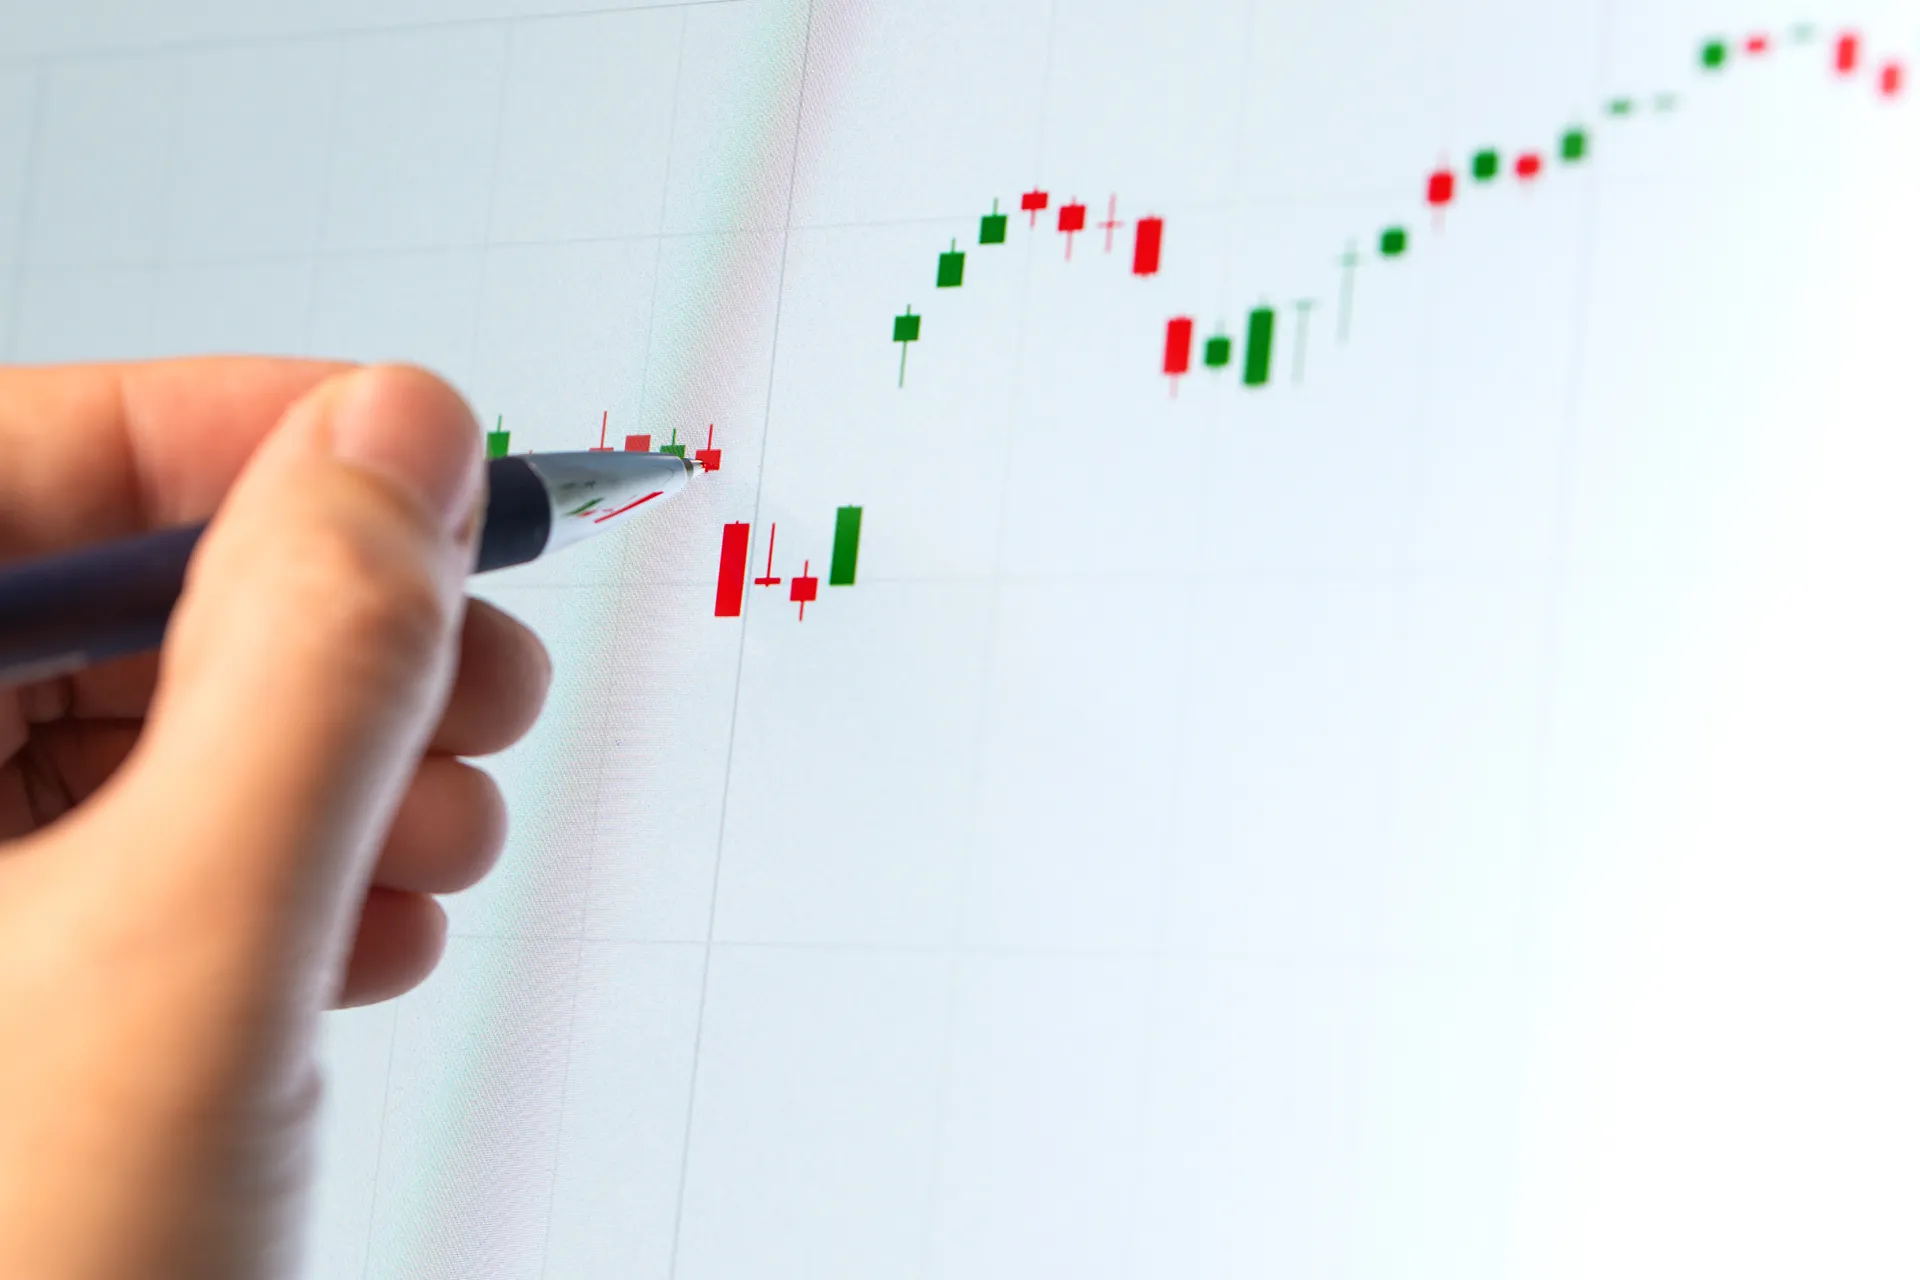


In the highly volatile world of cryptocurrency trading, technical analysis has come to serve as a serious tool in predicting price movements that help in devising successful trading strategies. Technical analysis, while going through a series of historic price data and trading volume, serves as an influencer on when to enter or exit a trade.
Most technical indicators, while taken from traditional financial markets, require special consideration during their implementation in crypto due to its special characteristics such as 24/7 trading and higher volatility. Following are some key patterns and indicators that every crypto trader should know about.

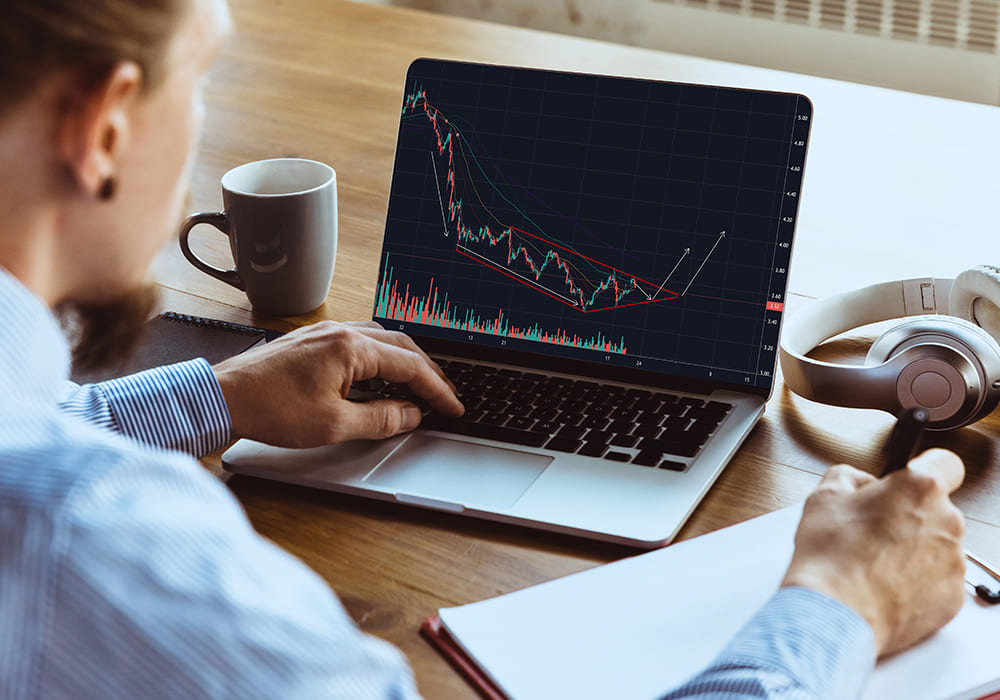
Key Chart Patterns in Crypto
Chart patterns are visual formations on the price chart, in which the pattern guides on potential price movements. Some of the popular patterns for crypto traders include:
- Head and Shoulders: This is a reversal pattern; it can be visualized as the “head” of a peak with a “shoulder” on either side. A break below the neckline usually flags a bearish reversal, while the inverse head-and-shoulders formation hints at a bullish shift.
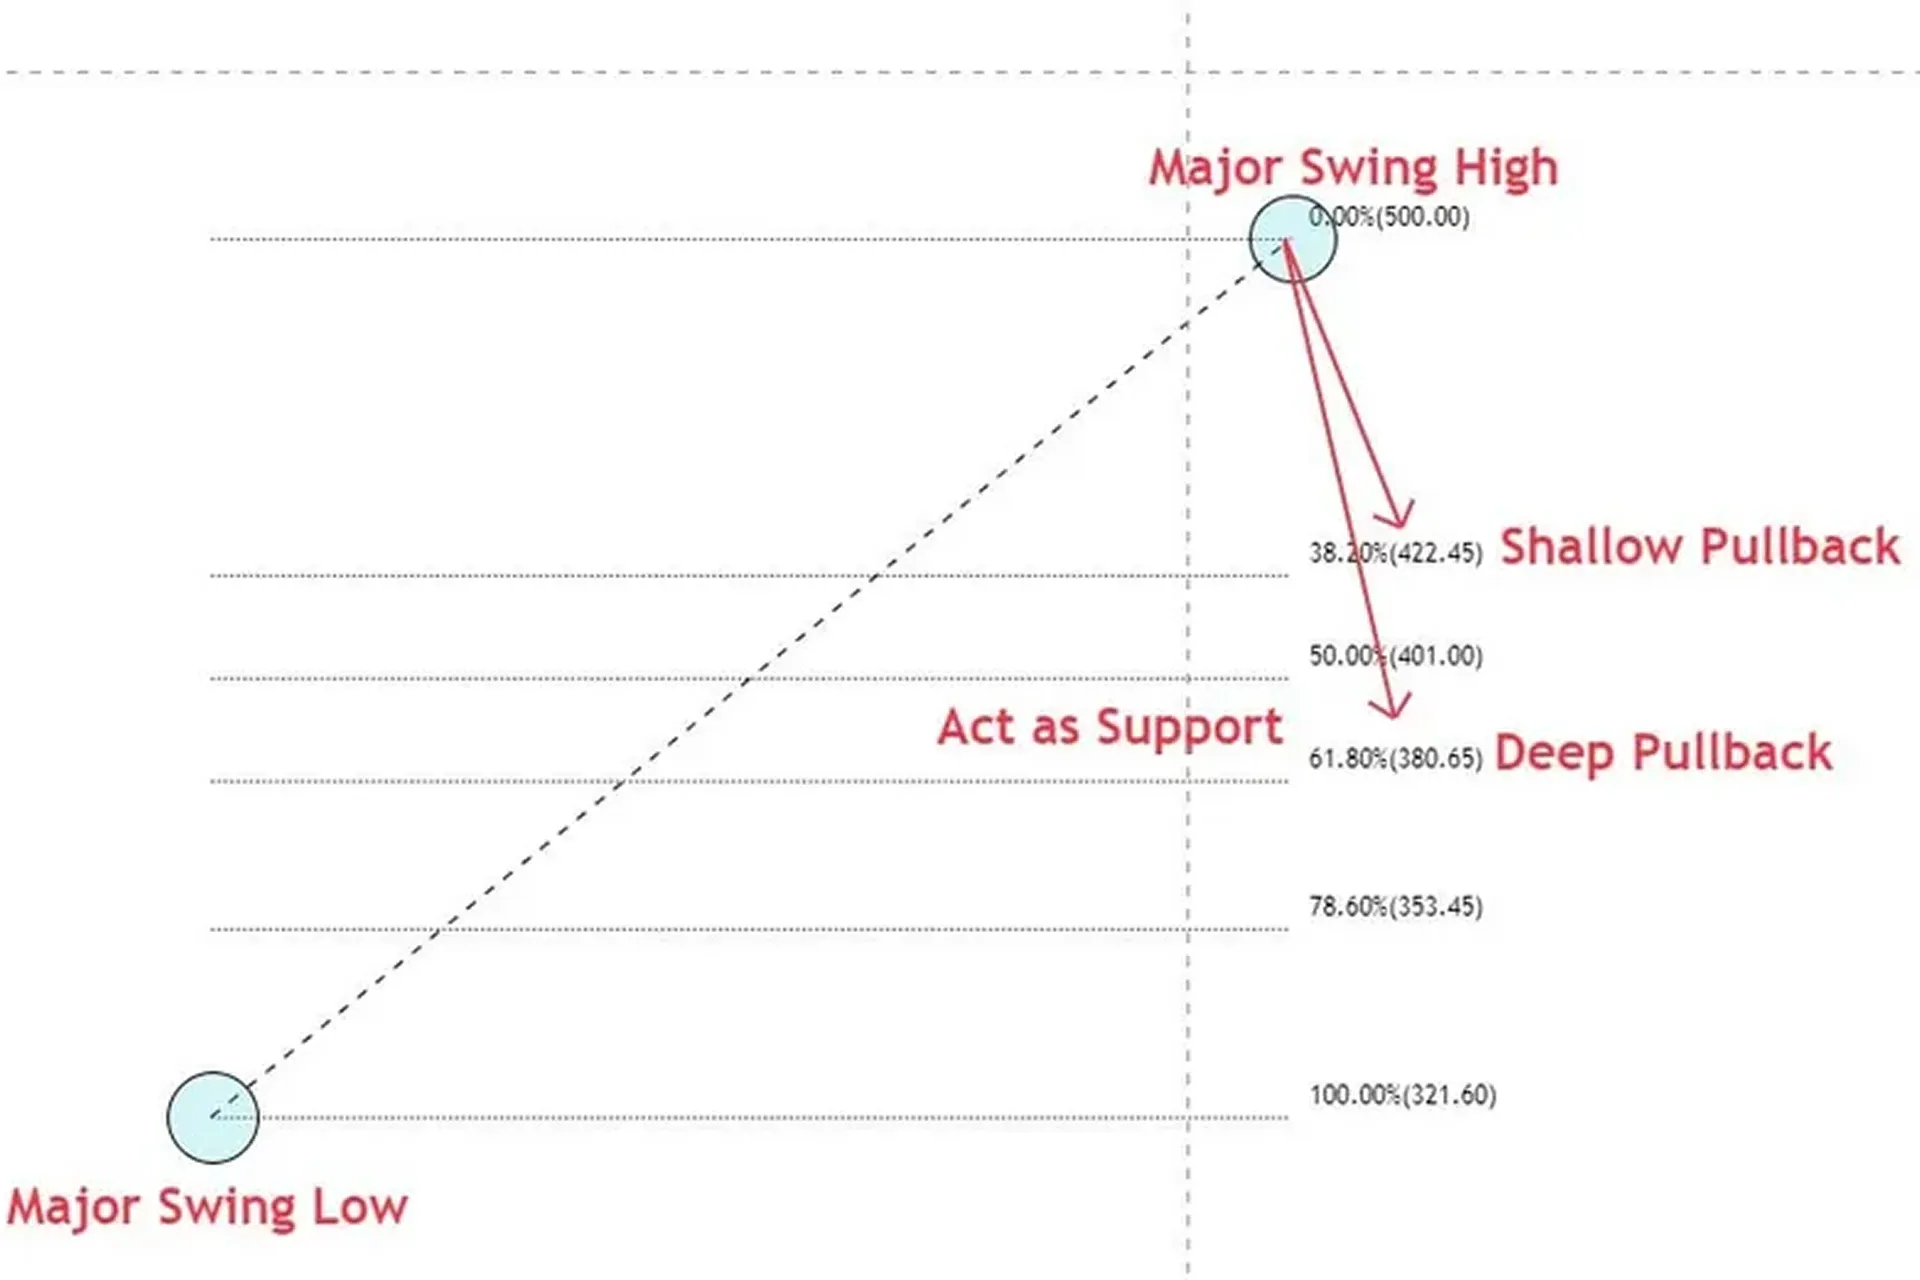
- Double Top and Double Bottom: The double tops are resistances when the price reaches the same high twice before falling, while the double bottom forms supports when the price hits the same low twice before rising. Both usually give very reliable trend reversals.
- Triangles: Symmetrical, Ascending, Descending Symmetrical triangles are usually signals of market indecision and tend to break out either way. Ascending triangles really just tend to signal a breakout that is bullish in nature, while descending triangles tend to precede bearish moves.
Chart patterns may be helpful to the trader in developing views on future price action, but one must also use other confirming indicators.
Key Indicators for Crypto Trading
Technical indicators supplement chart patterns by giving statistical data to support trading decisions. Some of the most widely used indicators within crypto trading include RSI, Moving Averages, and MACD.
One such momentum indicator is the Relative Strength Index, more commonly referred to as the RSI. It charts the velocity of the changes in price. Values of the RSI range from 0 to 100, and levels above 70 generally indicate overbought conditions, whereas those below 30 can potentially be an indication of an oversold condition. RSI values are, in particular, helpful for attempting to foresee potential trend reversals in crypto markets that may show sharp price swings within a relatively short span of time.
A very good tool that allows for smoothing out price data and hence makes it easy to identify trends is the MA. Commonly, there is a Simple Moving Average, SMA, which normally calculates an average price over a set period, and the Exponential Moving Average, EMA, which gives more weight to the recent prices. When the short-term MA crosses above the long-term MA-a bullish crossover-it can indicate an uptrend. On the other hand, a bearish crossover happens when the short-term MA falls below the long-term MA.
MACD stands for Moving Average Convergence Divergence, a trend-following indicator that reflects the relationship between two moving averages of a price. MACD is used to discern possible buy and sell signals whereby crossover points between the MACD line and the signal line serve as potential trend changes.
Tips for Effective Technical Analysis in Crypto!
Multi-indicators: One indicator cannot assure anything with certainty. The pattern and indicators together help in fine-tuning the probability of getting a better output from your analysis, such as using RSI in conjunction with moving averages.
- Set Stop Loss and Profit Targets: In any crypto trade, the stop-loss you set saves you from potential losses and the profit targets ensure that you lock in some gain once there is favorable movement in the market.
- Keep Track of Market News: Crypto heavily relies on news, regulation, and worldwide sentiment. Combine news with TA to stay on top of sudden changes that occur in the market.
Final Thoughts:
Technical analysis gives informative data in crypto trading through major patterns and indicators like RSI, moving averages, and MACD.
Once a trader has mastered the various techniques and applied them integratively, every trader can make more profitable decisions in the fast-changing cryptocurrency market. Keep in mind that technical analysis is optimally utilized when put together with effective risk management and knowledge of current events happening in the market.