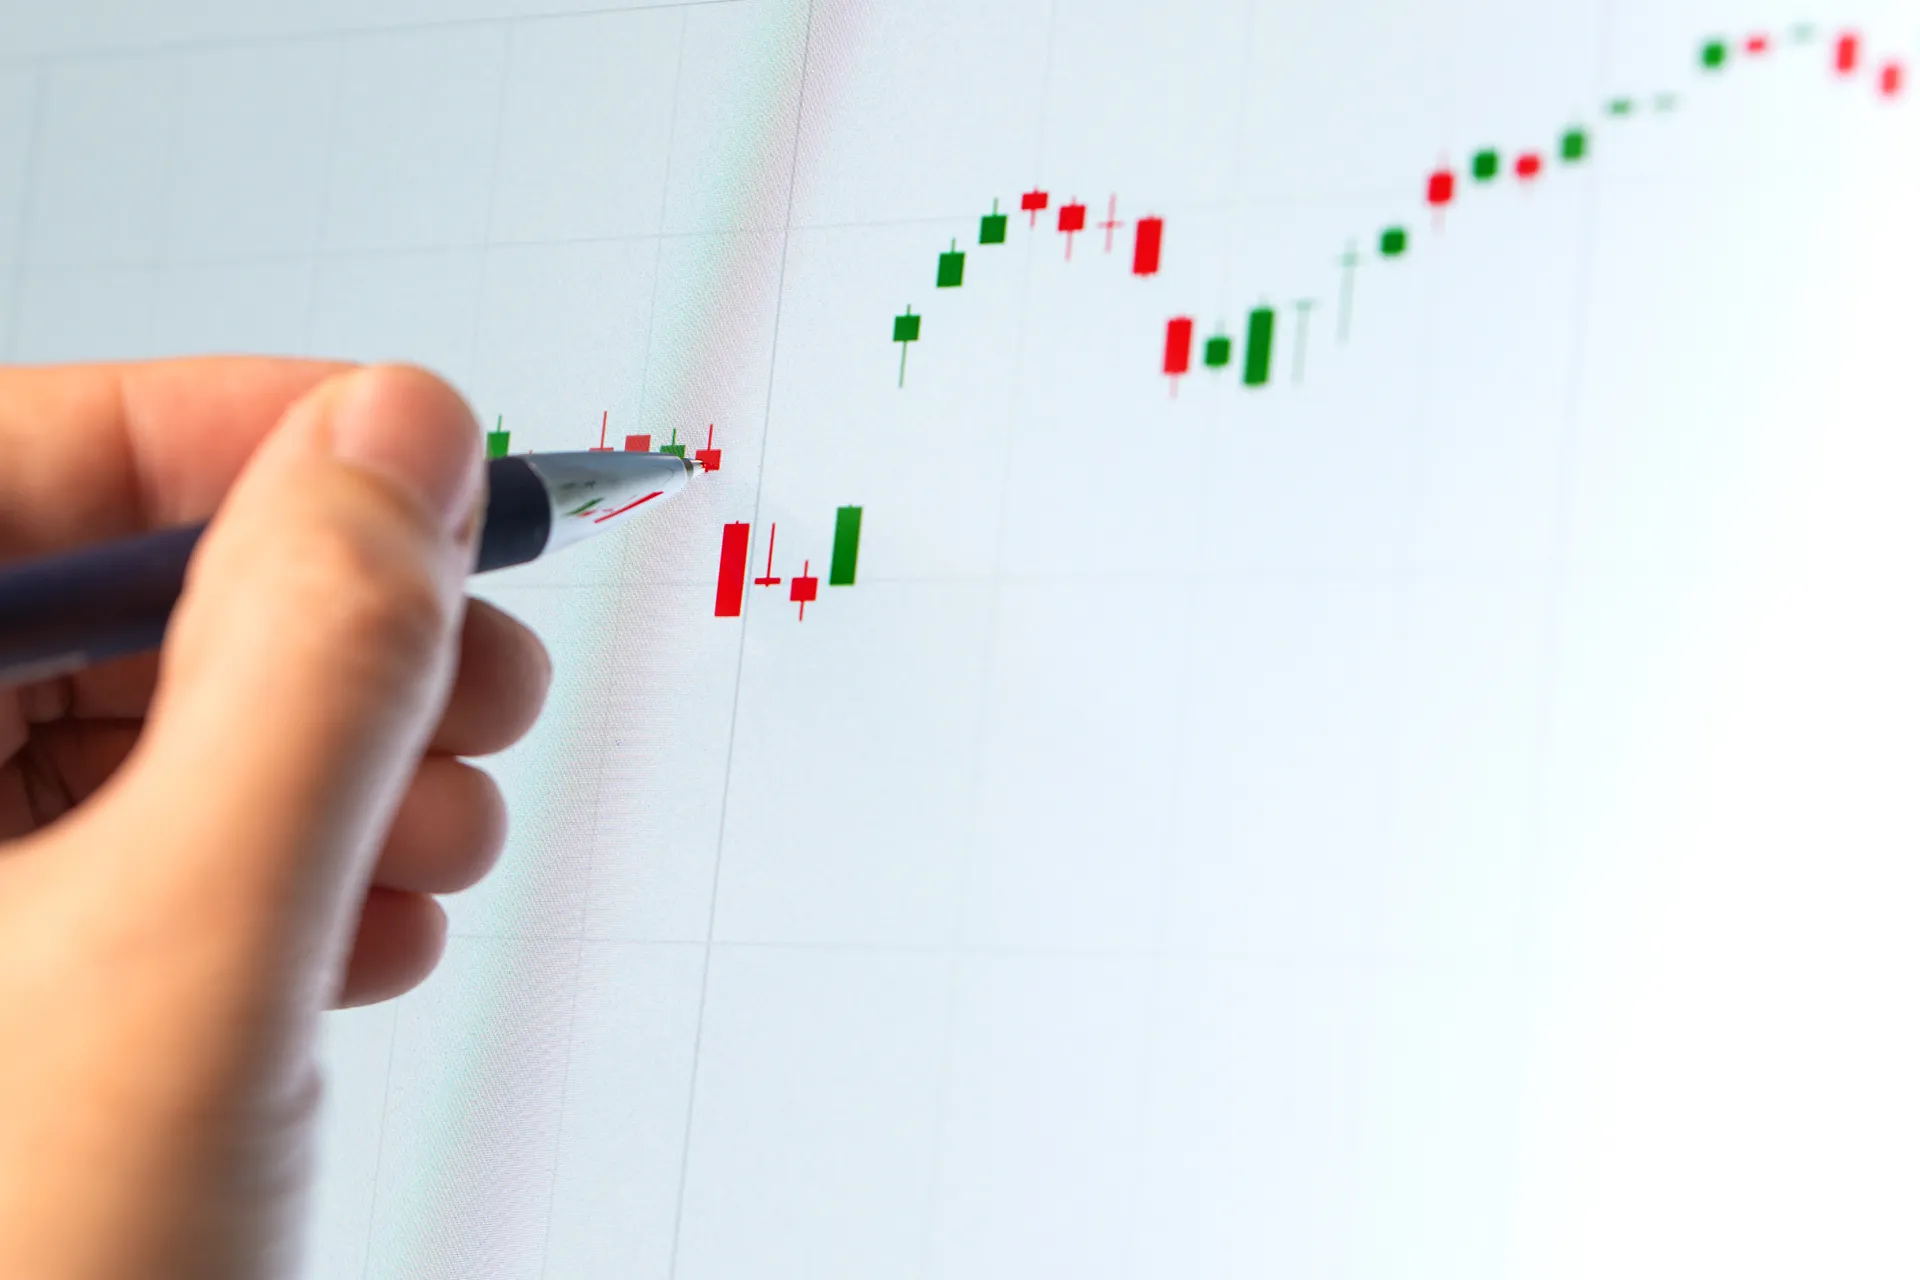


Price movements often follow recognizable patterns, even in fast-changing markets. Traders look for structured ways to identify where the price may pause or reverse. Fibonacci retracement trading 2026 offers a practical framework for spotting these areas with consistency.
On ZenGTP, Fibonacci tools are applied across multiple markets, including forex trading,stocks trading, and commodities trading, helping traders maintain a unified approach across instruments.
Disclaimer: This article is for educational purposes only and does not constitute investment advice. Trading involves risk, and decisions should be based on your own analysis.
What Fibonacci Retracement Represents
Fibonacci retracement is based on ratios derived from mathematical sequences that appear frequently in natural patterns. In trading, these ratios help identify areas where price may react after a strong move, offering a structured view of potential retracement zones.
Traders often combine Fibonacci with concepts like support and resistance and technical analysis to improve their understanding of price behavior and market structure.
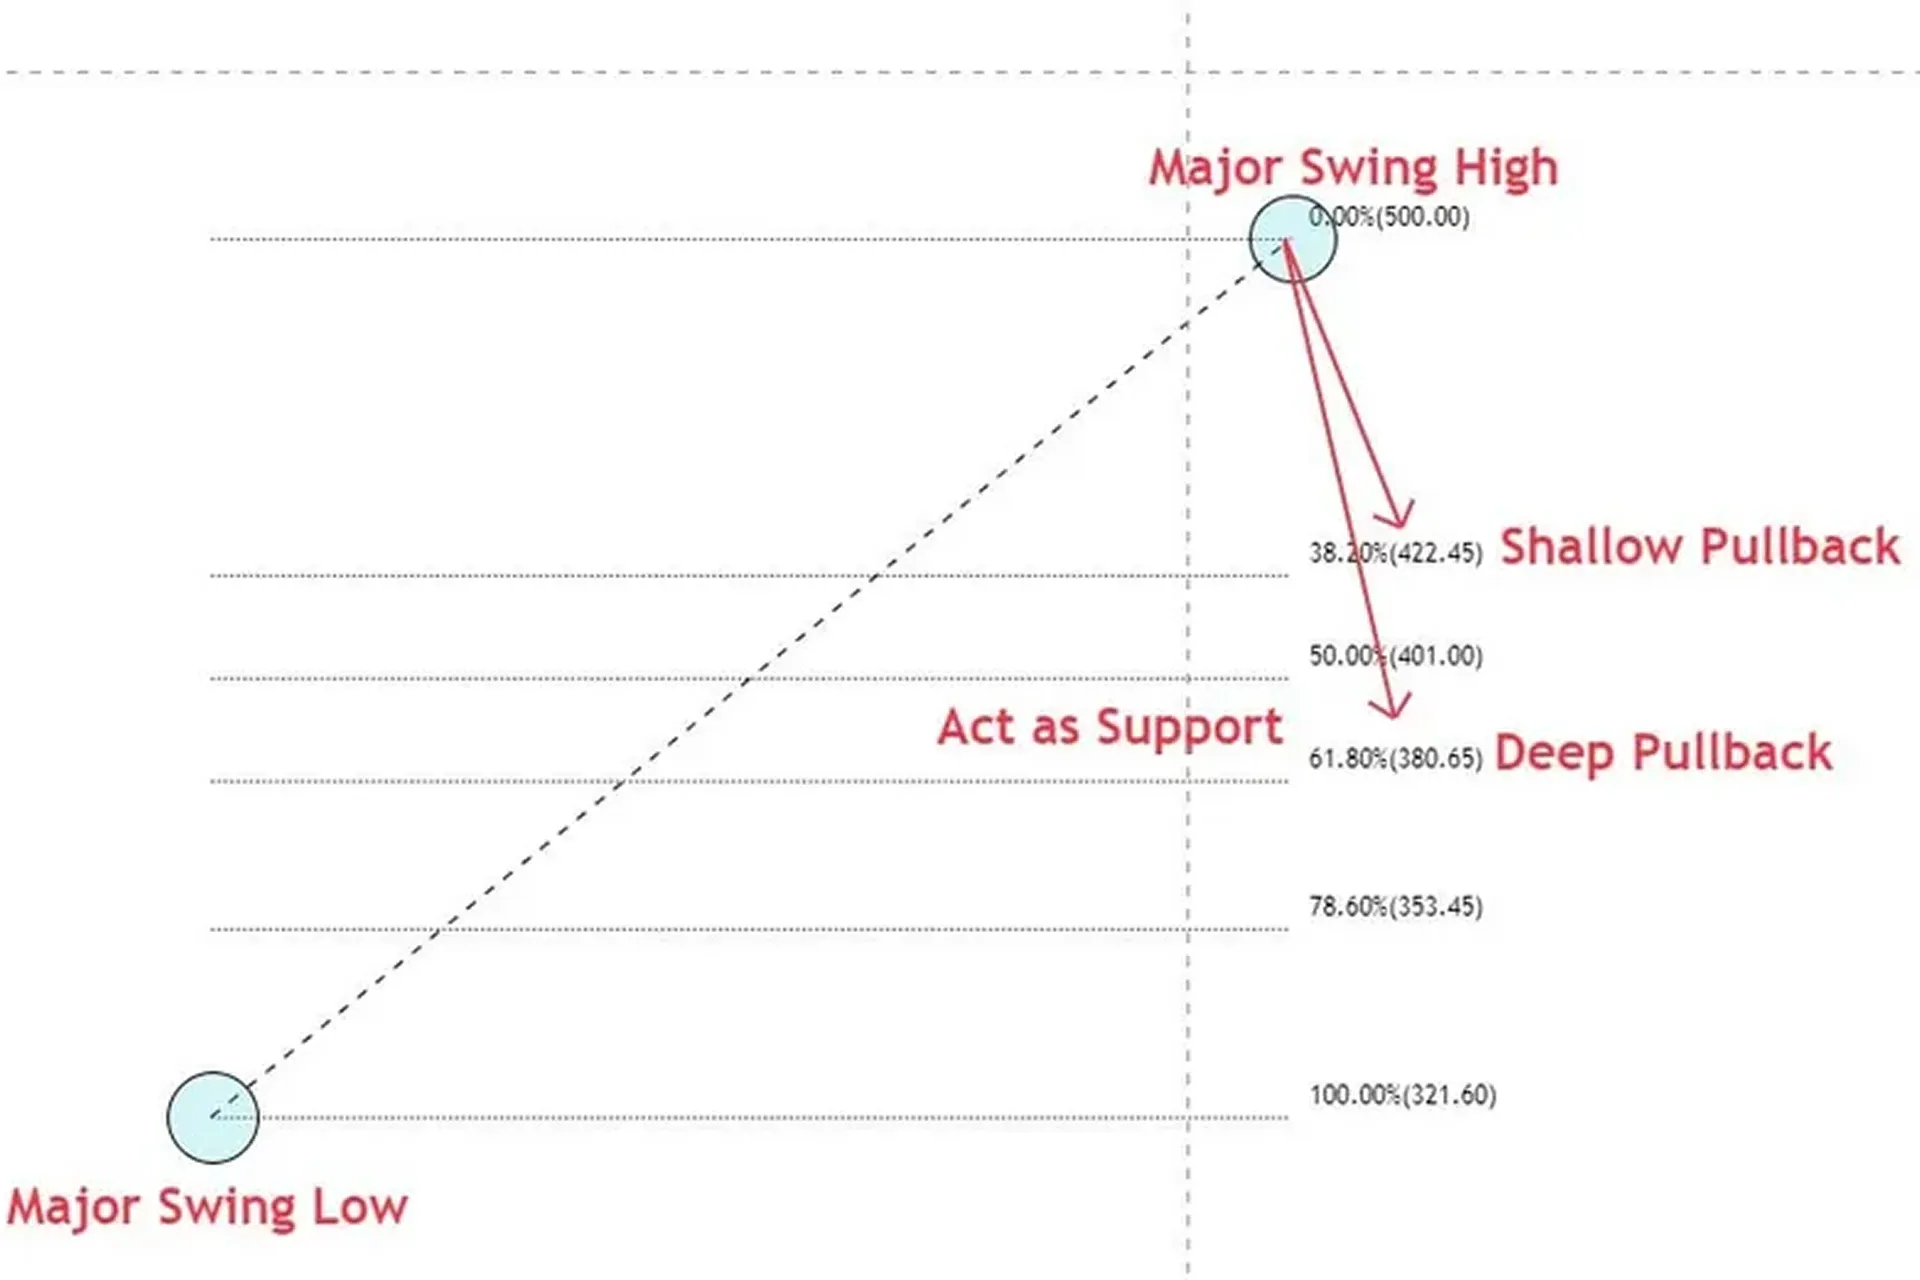
Key Fibonacci levels are commonly interpreted in the following way:
- 23.6 percent suggests a shallow pullback in strong trends
- 38.2 percent reflects moderate retracement
- 50 percent represents a psychological midpoint
- 61.8 percent indicates a deeper correction
- 78.6 percent shows extended retracement potential
These levels provide reference points rather than exact values. Traders should expect prices to react within a range instead of a precise level, which helps reduce overreliance on exact entries.
Note Fibonacci levels highlight potential reaction zones, not guaranteed turning points.
Why Fibonacci Works Across Markets
Fibonacci retracement works because many traders monitor the same levels, creating repeated reactions across markets. This shared focus can influence price behavior, especially in widely traded assets where participation is high.
On ZenGTP, traders apply Fibonacci across crypto trading and indices trading to maintain consistent analysis regardless of asset type.
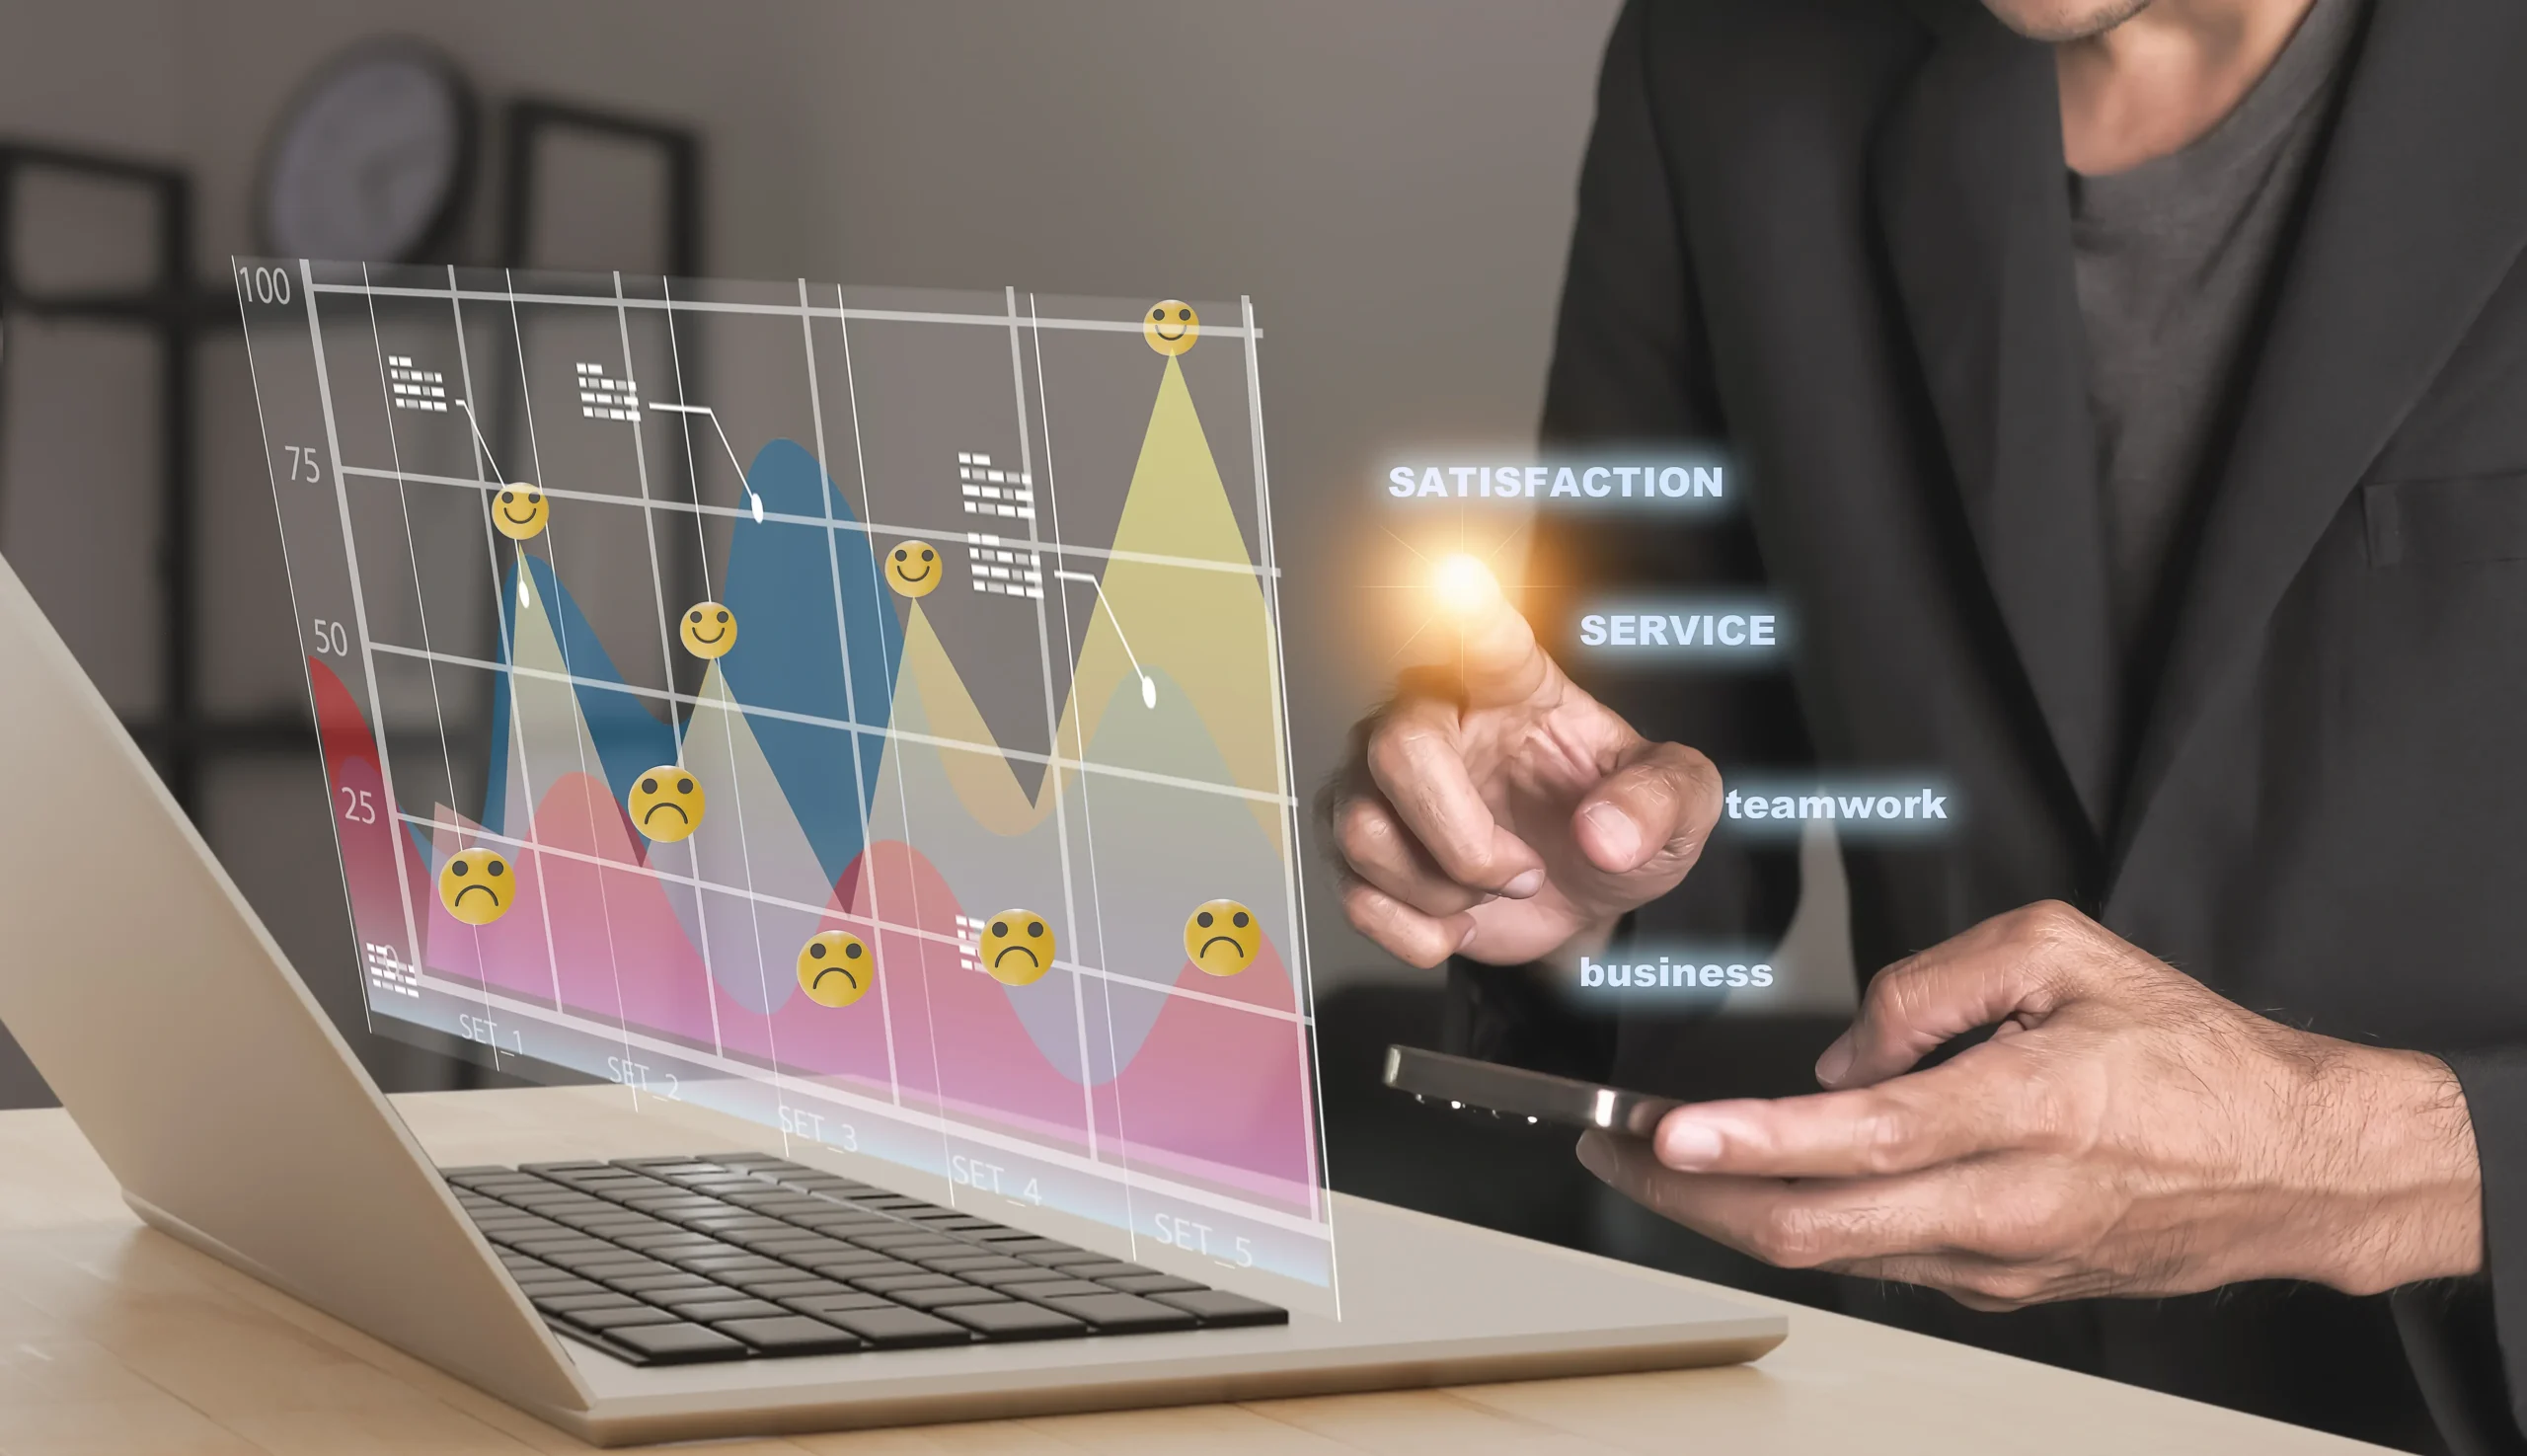
It also integrates effectively with tools such as market sentiment analysis and market volatility, helping traders understand broader conditions before making decisions.
Fibonacci retracement offers several practical benefits when applied correctly:
- Helps identify structured entry zones
- Works across multiple asset classes
- Supports disciplined trade planning
- Aligns with broader market behavior
- Enhances chart clarity and focus
These advantages make Fibonacci a reliable addition to a trader’s toolkit when used with proper context.
How to Draw Fibonacci Retracement Properly
Correct application is essential for reliable results. Fibonacci should be drawn on clear directional moves, not random price fluctuations, ensuring the levels reflect meaningful price structure instead of noise.
In an uptrend, traders draw from the lowest point to the highest point. In a downtrend, they draw from the highest point to the lowest point, aligning the tool with real price movement.
Fibonacci retracement is often introduced in educational materials as a way to examine how price movements are analyzed within a trend context:
- Price movements are typically assessed to identify directional phases
- Reference points such as swing highs and lows are commonly discussed
- Fibonacci levels represent proportional retracement areas within a move
- Price reactions are often observed around these levels
- Levels may be revisited as new price data develops
This structured process helps maintain consistency and improve accuracy over time, especially when reviewed alongside trend identification techniques.
Tip: Always apply Fibonacci to clear trends rather than sideways markets.
Fibonacci Behavior in Different Conditions
Market conditions influence how price interacts with Fibonacci levels. In strong trends, prices often respect shallower retracements, while weaker trends tend to move toward deeper levels before continuing or reversing.
Understanding this helps traders adapt their expectations and avoid forcing trades in unclear environments, especially during high volatility periods.
| Market Condition | Common Level Reference | How It Is Commonly Interpreted | Observational Notes | Market Condition |
| Strong trend | 38.2% | Often associated with shallow retracements | May appear during sustained directional movement | Strong trend |
| Moderate trend | 50% | Sometimes described as a balanced correction level | Observed within ongoing trend phases | Moderate trend |
| Weak trend | 61.8% | Often linked to deeper retracement discussions | May coincide with reduced trend strength | Weak trend |
| High volatility | 78.6% | Associated with extended price movements | Can occur during rapid or unstable conditions | High volatility |
| Range | Mixed levels | Linked to unclear directional context | Common in sideways or consolidating markets | Range |
This framework helps traders align expectations with real market conditions and improve decision quality over time.
Warning: Fibonacci signals weaken significantly in ranging or unstable markets.
Combining Fibonacci With Other Tools
Fibonacci retracement becomes more effective when combined with other tools, providing confirmation and reducing reliance on a single signal. This improves overall trade structure and clarity.
Traders often combine Fibonacci with economic indicators and concepts from navigating volatility to better understand timing and market behavior.
On ZenGTP, additional tools from the education center and economic calendar support better timing and structured planning.
Combining Fibonacci with other methods strengthens analysis:
- Use with support and resistance levels
- Confirm with candlestick behavior
- Align with overall trend direction
- Consider volatility conditions
- Check timing around economic events
This layered approach improves consistency and reduces unnecessary trades.
Conclusion
Fibonacci retracement remains a valuable tool for identifying structured price levels and improving trade planning. It helps traders focus on key zones instead of making random decisions.
With consistent practice and proper context, Fibonacci retracement trading 2026 becomes a reliable part of a structured trading approach on ZenGTP, supporting better analysis across markets.
FAQ
What is Fibonacci retracement in trading?
It is a tool used to identify potential support and resistance levels based on mathematical ratios applied to price movements.
Does Fibonacci work in all markets?
Yes, it is commonly used in forex, stocks, indices, commodities, and crypto markets due to its universal application.
Which Fibonacci level is most important?
The 61.8 percent level is often considered significant, but all levels should be interpreted within context.
Can Fibonacci predict price direction?
No, it highlights possible reaction zones, while direction depends on market conditions and confirmation signals.
How do I improve my use of Fibonacci?
Focus on clear trends, combine them with other tools, and review your trades regularly to refine your approach.